Understanding Ethiopia’s low and falling tax-to-GDP ratio: key findings and lessons for other countries
Published: Aug. 15, 2025Vedanth Nair, David Phillips, Edris Seid, Ben Waltmann and Mulay Weldu Asegegehn.
The tax-to-GDP ratio of Ethiopia is low and has been persistently falling for more than a decade. This contrasts with the usual trend of a rising tax-to-GDP ratio as countries grow richer. Expanding formal sectors and increasing administrative capacity should, in theory, raise the fraction of national income that is collected in taxation. However, some countries with robust GDP growth have experienced falling tax-to-GDP ratios, such as Kenya, Rwanda and Indonesia. This trend has been particularly pronounced in Ethiopia.
This unusual trend should be analysed and reversed by addressing policy and administration gaps. The Ethiopian Ministry of Finance’s Tax Policy Department in collaboration with TaxDev have conducted a detailed analysis of Ethiopia’s tax-to-GDP ratio potential, the factors behind Ethiopia’s low tax-to-GDP ratio, and the factors behind the fall. The full report can be found here.
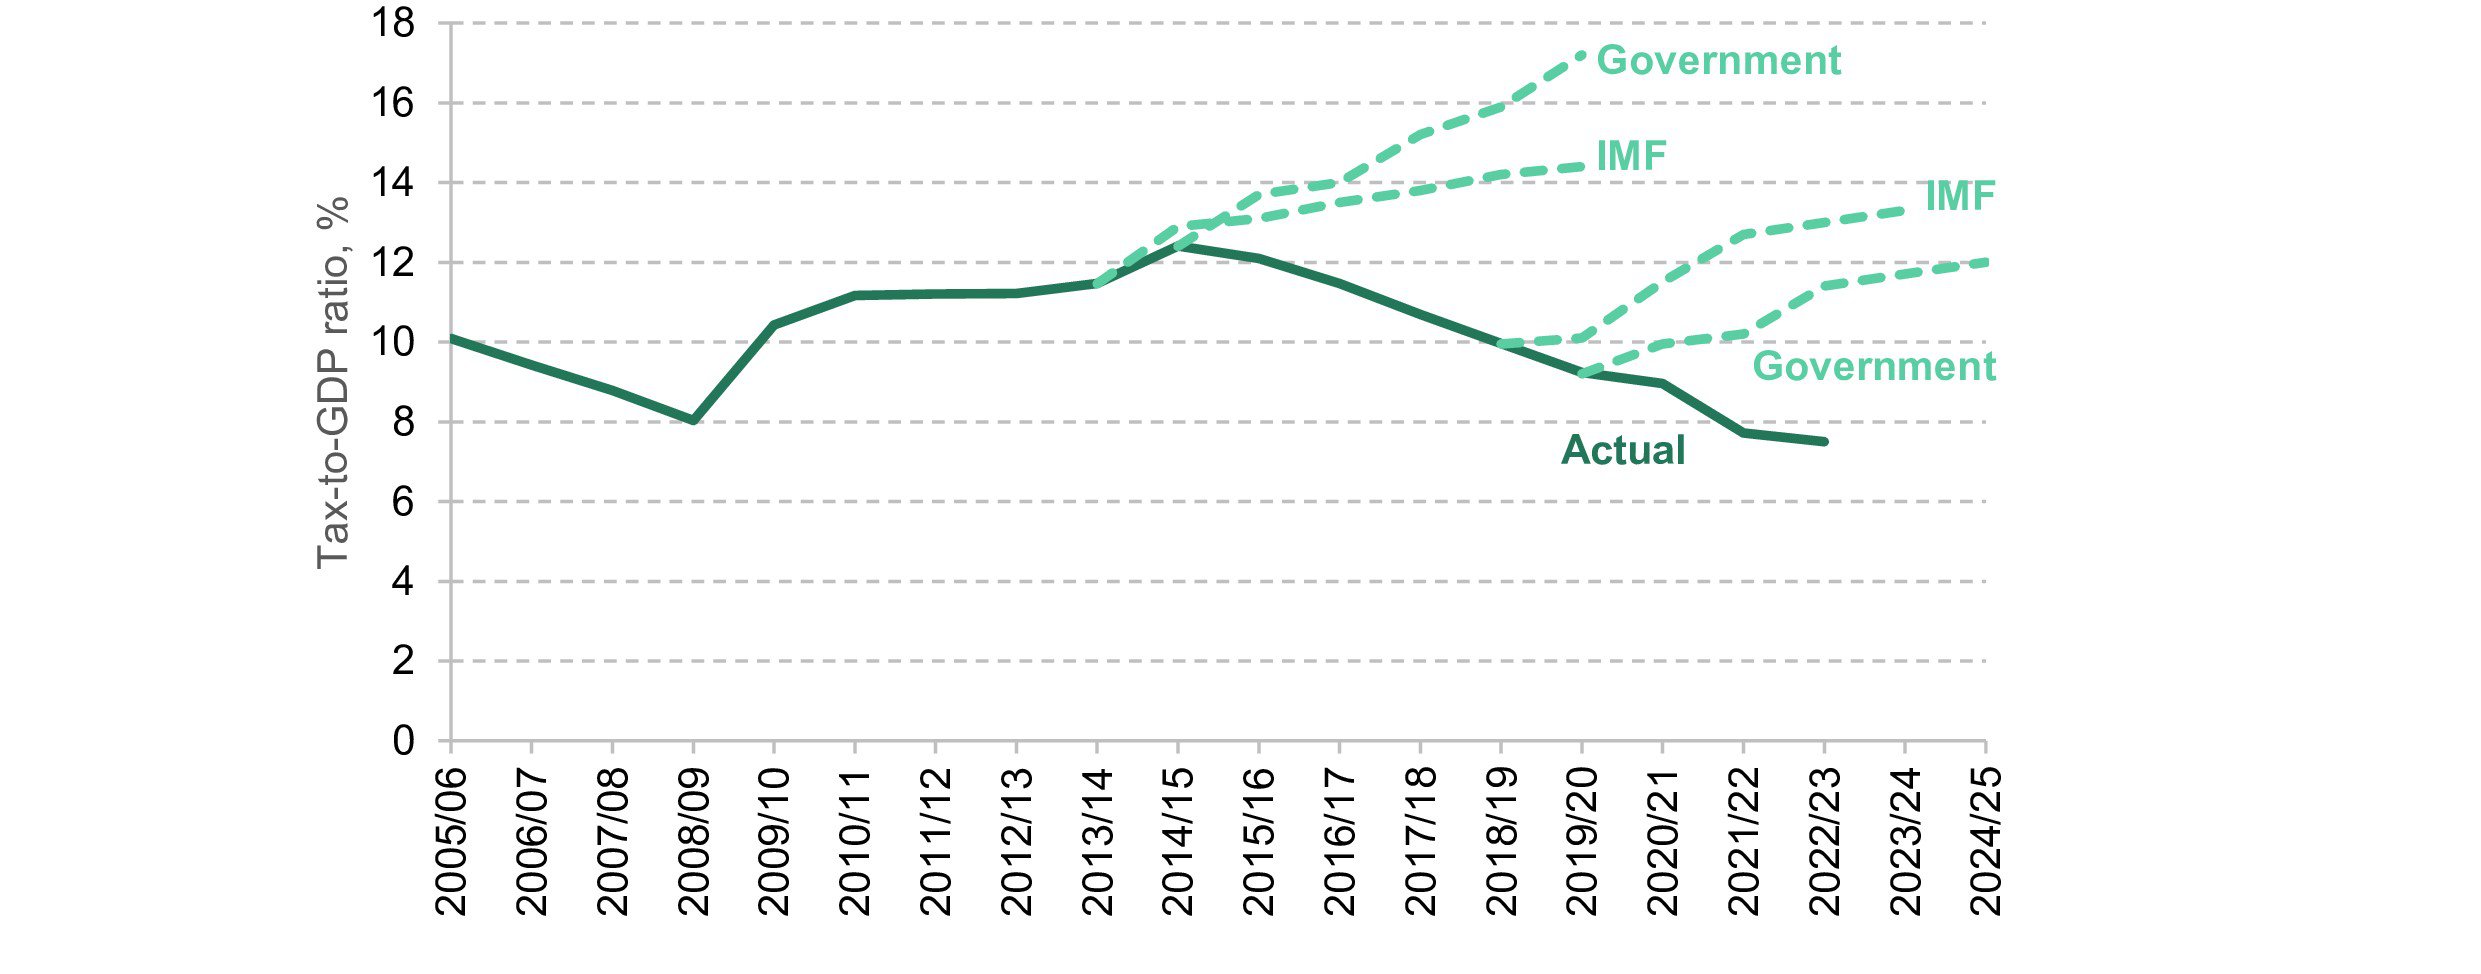
Between 2014/15 and 2022/23, Ethiopia’s tax-to-GDP ratio fell from 12.4% to just 7.5%, despite average annual GDP growth of 8%. The decline in the tax-to-GDP ratio has run counter to government and IMF forecasts, as shown by the graph below. The largest contributors to the decline were VAT, which declined by 2.4 percentage points of GDP, followed by trade taxes (1.1pp), corporate income tax (0.7 pp) and employment income taxes (0.3pp).
Figure 1. Ethiopia’s tax-to-GDP ratio, actual and forecast
So, why has Ethiopia’s tax-to-GDP ratio fallen?
The role of the public sector in tax collection
Much of the answer lies in the changing structure of Ethiopia’s economy, and the interaction of this with Ethiopia’s revenue collection system and tax structure.
Ethiopia’s high rate of economic growth in the early-to-mid-2010s was driven by investment. Especially important was state-backed investment in projects such as the Grand Ethiopian Renaissance Dam and the Addis–Djibouti railway, as well as road, energy, irrigation and housing development projects. This investment boom has now largely come to an end. Investment as a share of GDP fell from 37% in 2015/16 to 22% in 2022/23, of which investment by the government and state-owned enterprises fell from 14% to 7% (in 2021/22), according to data from the World Bank.
Some of this investment flowed back into the government’s coffers in the form of higher tax revenues. VAT withholding was an important channel: all public sector entities in Ethiopia are required to withhold VAT on their purchases, effectively ensuring compliance among suppliers to the public sector. As public sector investment decreased, VAT compliance gaps widened – particularly in sectors like construction that were heavily reliant on public contracts. A major contributor to the decline in corporate income tax revenues was the decline in profitability of the state-owned Commercial Bank of Ethiopia, which was heavily involved in financing public sector investment. The decline in public sector spending relative to GDP also explains much of the fall in personal income tax revenues, given the relatively large share of PIT revenues paid by public sector workers. This fall would have been steeper had personal income tax thresholds not been frozen in nominal terms.
While the continued strong growth in GDP suggests that private sector activity and consumption has taken the place of investment as an engine of growth, that has not translated into equivalent tax revenues – because existing administrative systems are not as effective at collecting revenue directly from the private sector. In addition, our analysis suggests that a decline in tax compliance within the private sector has also contributed to the fall in Ethiopia’s tax to GDP ratio, on top of these more structural factors. That is particularly true for VAT and corporate income tax where lower compliance may explain half of the fall in revenues relative to GDP. And detailed sectoral data suggest that non-compliance is a particular issue in the construction, retail and wholesale sectors.
Falling imports and the overvaluation of the Birr
Another major economic shift is the decline in the ratio of imports to GDP, which led to an almost one-for-one decline in the ratio of import tax revenues to GDP. The decline in imports is partly linked to lower public sector investment: a large share of Ethiopia’s imports during the investment boom were capital goods used in infrastructure projects.
The overvaluation of the Birr also contributed to the decline in the ratio of import tax revenues to GDP, especially from 2021 onwards. It did this by depressing the value of imports and hence import taxes in Birr, relative to the value of domestically produced goods and services that make up GDP. Defending the overvalued Birr also required rationing the use of foreign currencies and hence imports, further reducing import tax revenues. Ethiopia’s 2024 currency devaluation (announced after our report was substantively complete) has started to reverse the decline in import tax revenues: real-terms customs duty revenues in the nine months from July 2024 were double those recorded in the nine months from July 2023.
Other potential factors
The report also considers the role of several other factors in explaining the fall in Ethiopia’s tax-to-GDP ratio.
Recent changes in tax policy do not appear to have contributed significantly to the fall in tax revenues. There were no major revenue-reducing policy reforms during this period. High profile VAT exemptions on selected food items brought in to address cost-of-living pressures are estimated to have cost less than 0.1% of GDP. Some long-standing choices, such as not collecting VAT and excises on fuel, help explain why Ethiopia’s tax-to-GDP ratio is lower than in many other comparable countries, but not the recent decline.
The report also investigated the possibility that the measured tax-to-GDP ratio has fallen, in part, because GDP growth has been overestimated. Reported GDP growth has been very high in Ethiopia and much higher than GDP growth as predicted by two alternative measures of economic activity: urban employment earnings and night-time lights as measured by a satellite. But these alternative measures of GDP growth have serious shortcomings, and a third alternative measure of GDP, aggregate consumption as recorded in the Ethiopia Socioeconomic Survey, is entirely consistent with reported GDP growth. With this mixed evidence, it is not possible to definitively conclude that over-estimation of GDP growth means that the fall in the tax-to-GDP has been overstated.
Lessons for other countries
What might other countries learn from both Ethiopia’s experience and the methods used in our joint study?
First, tax-to-GDP ratios can be vulnerable when revenues are highly reliant on a relatively narrow set of economic activities, especially if administrative capacity to tax other activities is not well developed. Ethiopia has been heavily reliant on the relatively easier-to-tax public sector and imports for its tax revenues. As these parts of the economy have shrunk relative to GDP, so too has Ethiopia’s tax-to-GDP ratio. In other countries, it could be extractives or the finance sector that there is a particular reliance on. Sustainably raising the tax-to-GDP ratio requires a diversified tax base, and effective collection and enforcement mechanisms across the economy.
Second, trade, exchange rate and financial policies can have significant effects on tax revenue. Addressing over-valued currencies and reducing restrictions on foreign exchange transactions and capital flows are not painless but can generate revenues, sometimes rapidly.
Turning to lessons from our analytical approach, it is important to recognise that understanding why a country’s tax-to-GDP ratio is declining or stagnating is rarely straightforward. There is no one-size-fits-all methodology. But one general lesson is the value of combining data from a range of sources - particularly tax microdata - with close attention to the specific features of the country’s economy and tax system.
In Ethiopia, VAT gap analysis – using a version of the IMF’s RA-GAP method adapted to the country context – underpinned the analysis of the decline in the VAT-to-GDP ratio. The findings, together with tax microdata on VAT withholding, pointed to a link between public sector investment and VAT compliance.
Although the link between the decline in import tax revenues and value of imports was clear, the underlying reasons for the drop in the value of imports were less so. Customs microdata was used to break down the decline into the change in the volume of imports and changes in the prices of imported goods (relative to domestically produced goods). This allowed for the role of changes in import demand and the overvaluation of the Birr to be better understood. Comparing import values with the value of exports by trade partners recorded in the UN Comtrade database helped rule out the hypothesis that the undervaluation of imports by traders was a contributor to the decline in measured import values and tax revenues.
For the corporate income tax, a full-blown CIT gap analysis was not possible due to data limitations. However, comparing changes in each sector’s contribution to GDP with its revenue contributions pointed to potential changes in compliance. Data from the Commercial Bank of Ethiopia’s annual reports allowed for the fall in the bank’s corporate income tax contributions to be linked to public sector investment. Household survey data was used to understand the factors underlying trends in personal income tax revenues, as well as to examine how official measures of GDP growth compared to changes in consumption and wages.
Country-specific knowledge provided by our partners at the Ethiopian Ministry of Finance and other parts of the Government of Ethiopia was also vital. It helped to guide the analysis, develop hypotheses, and interpret the data.
This detailed, country-specific analysis can generate insights that higher-level approaches cannot. A large body of research has sought to model countries’ potential tax-to-GDP ratios based on broad economic indicators like income levels or trade flows. In Ethiopia’s case, such models suggested that the decline in the tax-to-GDP ratio could not be explained by changes in economic structure. However, the tax microdata told a different story: changes in the structure of the economy clearly mattered. The disconnect arises because cross-country models do not fully account for country-specific factors – in Ethiopia’s case, its traditional reliance on the public sector for tax revenue , including through the tax withholding system, and relatively weaker capacity to collect revenues directly from the private sector.
The greater availability of tax microdata – which has improved substantially in Ethiopia – and diagnostic tools such as VAT gap modelling makes this type of analysis more possible. In Ethiopia, there is still more work that can be done. In particular, further analysis is needed to understand why compliance with VAT and corporate income tax declined beyond what can be explained by changes in the structure of the economy. And other countries – particularly those also facing stagnant or falling tax-to-GDP ratios – should consider undertaking their own detailed analysis of the underlying causes.